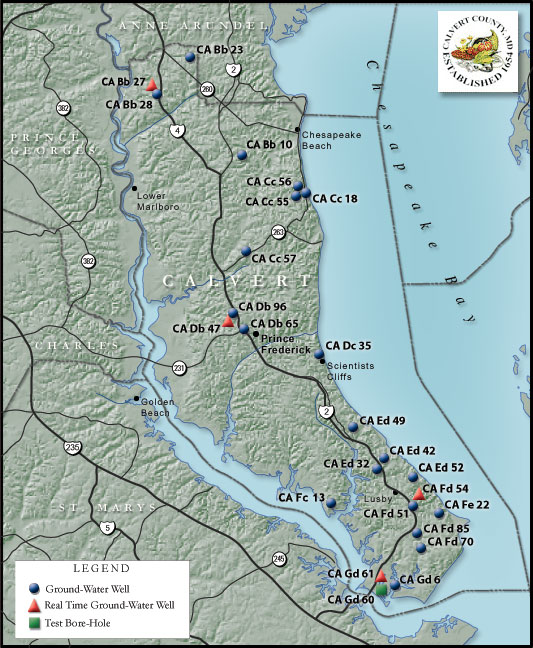
Groundwater Wells in Calvert County, Maryland
The Calvert County Groundwater-Level Monitoring Network is a cooperative program between the Calvert County Department of Public Works, Bureau of Utilities, the Maryland Geological Survey, and the U.S. Geological Survey. This network of appoximately 42 wells is mainly focused on monitoring the deeper, confined aquifers that are affected by local and regional Groundwater withdrawal.
The major aquifers of interest are the Piney Point-Nanjemoy, Aquia, and Magothy aquifers. The Piney Point-Nanjemoy aquifer is primarily used for small water users, such as self-supplied domestic users and small businesses. The Aquia aquifer is the primary source of public water supply within the county. A recent study in the tri-county area of Southern Maryland (Calvert, Charles, and St. Mary’s Counties) drilled 6-monitoring wells to study the availability of water in the upper and lower Patapsco aquifers. As a part of this tri-county study, in Calvert County a monitoring well was drilled in both the upper Patapsco aquifer (CA Db 96), and lower Patapsco aquifer (CA Fd 85). Two water-table monitoring wells (CA Db 65, and CA Fc 13) are used as climate response wells for indicating local Groundwater recharge and drought conditions.
The U.S. Geological Survey and the Maryland Geological Survey began a Statewide cooperative monitoring network in 1943. Several private wells in the Solomons area (CA Gd 3 and CA Gd 4) of Calvert County were some of the first wells to be monitored. Well CA Gd 6 at the Calvert Marina, Solomons (formerly the U.S. Naval Amphibious Training facility) has been used for monitoring the Aquia aquifer since 1949 until 2004, and is the oldest Groundwater-level monitoring well on the Calvert County network. A well drilled by Calvert County in 2004 (CA Gd 61) as a part of this study for the real-time collection of water levels, is the newest well in the network, and will replace CA Gd 6 for measuring future Groundwater trends. The Table below lists selected Calvert County Groundwater-Level Monitoring wells shown on the clickable link map:
Monitoring Wells
| Well Number |
Aquifer/Formation Screened |
Location | Freq./Measure |
|
CA Bb 10 |
Magothy |
Mt. Hope | Twice Yearly |
| CA Bb 23 |
Magothy |
Cavalier Country | Twice Yearly |
| CA Bb 27 |
Aquia |
Dunkirk | Real-Time |
| CA Bb 28 |
Nanjemoy |
Dunkirk | Monthly |
| CA Cc 18 |
Aquia |
Randle Cliff | Monthly |
| CA Cc 55 |
Upper Patapsco |
Randle Cliff | Twice Yearly |
| CA Cc 56 |
Magothy |
Randle Cliff | Twice Yearly |
| CA Cc 57 |
Aquia |
Huntington | Monthly |
| CA
Db 47 |
Aquia |
Prince Frederick | Real-Time |
| CA Db 65 |
Brandywine |
Prince Frederick | Monthly |
| CA Db 96 |
Upper Patapsco |
Prince Frederick | Recorder |
| CA Dc 35 |
Magothy |
Scientist Cliffs | Twice Yearly |
| CA Ed 32 |
Piney Point-Nanjemoy |
White Sands | Twice Yearly |
| CA Ed 42 |
Aquia |
Calvert Cliffs | Twice Yearly |
| CA Ed 49 |
Piney Point-Nanjemoy |
Long Beach | Twice Yearly |
| CA Ed 52 |
Aquia |
Calvert Cliffs Power Plant | Recorder |
| CA Fc 13 |
Choptank-St.Marys Und. |
Jefferson-Patterson St. Pk | Monthly |
| CA Fd 51 |
Piney Point-Nanjemoy |
Calvert Cliffs St. Pk | Twice Yearly |
| CA
Fd 54 |
Aquia |
Calvert Cliffs St. Pk | Real-Time |
| CA Fd 70 |
Aquia |
Chesapeake Ranch Estates | Twice Yearly |
| CA Fd 85 |
Lower Patapsco | Chesapeake Ranch Estates | Recorder |
| CA Fe 22 |
Piney Point-Nanjemoy |
Cove Point | Twice Yearly |
| CA Gd 6 | Aquia | Solomons | Twice Yearly |
| CA
Gd 60 |
Brightseat |
Calvert County | |
| CA
Gd 61 |
Aquia |
Solomons | Real-Time |
Potentiometric Surface Maps
The Potentiometric Surface maps of the Aquia, Magothy, Upper Patapsco, and Lower Patapsco aquifers in Southern Maryland are presented below. These Potentiometric Surface maps are published annually by the U.S. Geological Survey as Open-File Reports. Potentiometric Surface maps are produced by collecting synoptic water levels over a short period of time from numerous wells throughout Southern Maryland in each of the four aquifers. These maps show the surface of the water levels related to sea level that reflect the static head. Areas that are stressed by extreme Groundwater withdrawal from well fields will display what is known in hydrologic terms as a cone of depression. On the Aquia aquifer Potentiometric Surface map, two areas in Calvert County show cones of depression, in the North Beach and Chesapeake Beach area, and in the Solomons area.
-
OF 2005-1004
By Stephen E. Curtin, David C. Andreasen, Judith C. Wheeler, Potentiometric Surface Map of the Aquia Aquifer in Southern Maryland, September, 2003, 1p. -
OF 2005-1005
By Stephen E. Curtin, David C. Andreasen, Judith C. Wheeler, The Difference Between the Potentiometric Surfaces of the Aquia Aquifer, September 1982 and September 2003 in Southern Maryland, 1p -
OF 2005-1006
By Stephen E. Curtin, David C. Andreasen, Judith C. Wheeler, Potentiometric Surface Map of the Magothy Aquifer in Southern Maryland, September, 2003, 1p -
OF 2005-1007
By Stephen E. Curtin, David C. Andreasen, Judith C. Wheeler, The Difference Between the Potentiometric Surfaces of the Magothy Aquifer, September 1975 and September 2003 in Southern Maryland, 1p -
OF 2005-1008
By Stephen E. Curtin, David C. Andreasen, Judith C. Wheeler, Potentiometric Surface Map of the Upper Patapsco Aquifer in Southern Maryland, September, 2003, 1p -
OF 2005-1009
By Stephen E. Curtin, David C. Andreasen, Judith C. Wheeler, The Difference Between the Potentiometric Surfaces of the Upper Patapsco Aquifer, September 1990 and September 2003 in Southern Maryland, 1p -
OF 2005-1010
By Stephen E. Curtin, David C. Andreasen, Judith C. Wheeler, Potentiometric Surface Map of the Lower Patapsco Aquifer in Southern Maryland, September, 2003, 1p -
OF 2005-1011
By Stephen E. Curtin, David C. Andreasen, Judith C. Wheeler, The Difference Between the Potentiometric Surfaces of the Lower Patapsco Aquifer, September 1990 and September 2003 in Southern Maryland, 1p OFR 03-255
S.E. Curtin, D.C. Andreasen, and J.C. Wheeler, Potentiometric Surface of the Aquia Aquifer in Southern Maryland, September 2002, 1 p., Scale 1:250,000.OFR 03-256
S.E. Curtin, D.C. Andreasen, and J.C. Wheeler, Potentiometric Surface of the Magothy Aquifer in Southern Maryland, September 2002, 1 p., Scale 1:250,000.OFR 03-257
S.E. Curtin, D.C. Andreasen, and J.C. Wheeler, Potentiometric Surface of the Upper Patapsco Aquifer in Southern Maryland, September 2002, 1 p., Scale 1:250,000.OFR 03-257
S.E. Curtin, D.C. Andreasen, and J.C. Wheeler, Potentiometric Surface of the Upper Patapsco Aquifer in Southern Maryland, September 2002, 1 p., Scale 1:250,000.OFR 03-258
S.E. Curtin, D.C. Andreasen, and J.C. Wheeler, Potentiometric Surface of the Lower Patapsco Aquifer in Southern Maryland, September 2002, 1 p., Scale 1:250,000.