Water Science for Maryland, Delaware and the District of Columbia
PrecipitationMonthly data from five Mid-Atlantic National Weather Service (NWS) stations were used to show the relation between monthly precipitation and monthly groundwater levels and streamflows. The NWS uses averages of data over the 30-year climate normal period from 1981 through 2010.
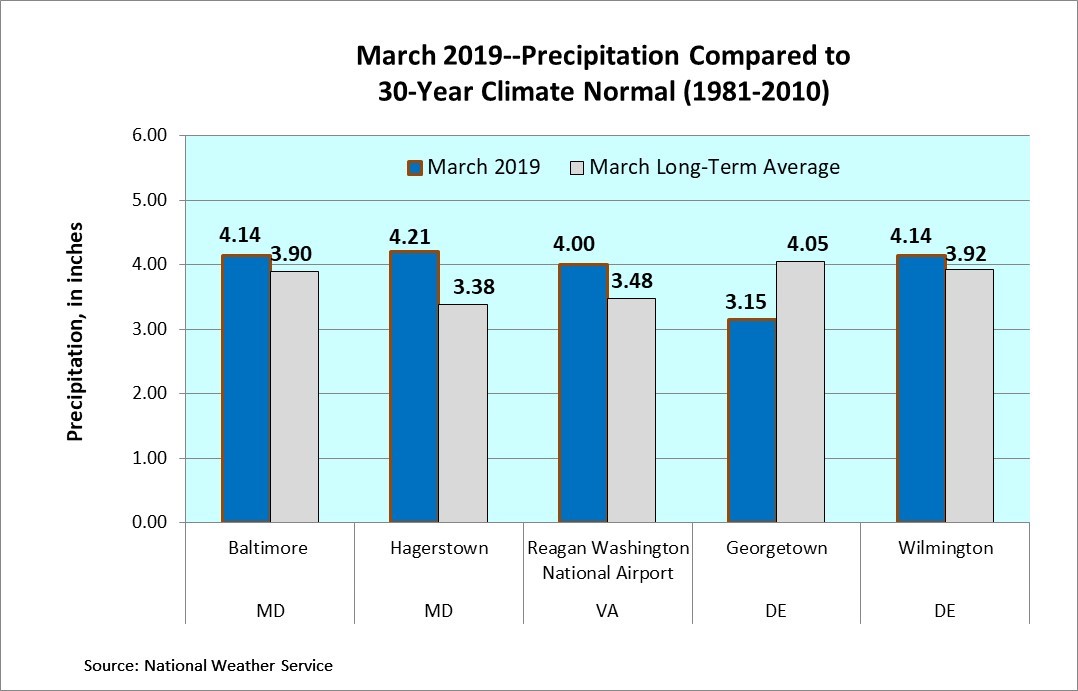
March 2019 PrecipitationPrecipitation was above normal at four Mid-Atlantic NWS weather stations and below normal at one NWS weather station in March. The long-term average March precipitation for the five Mid-Atlantic NWS weather stations is shown next to the March 2019 precipitation in the graph and map below.
The precipitation graph and map show March 2019 precipitation and the departure from the 30-year climate normal.
*The NWS normal (long-term average) period used for determining records is from 1981–2010
| ||

![]() U.S. Department of the Interior |
U.S. Geological Survey
U.S. Department of the Interior |
U.S. Geological Survey
URL: https://md.water.usgs.gov/waterdata/index.html
Page Contact Information: webmaster@md.water.usgs.gov