April 2013 - USGS Maryland-Delaware-District of Columbia Water Conditions Summary -More than 50 percent of groundwater and streamflow levels were normal, and more than 25 percent of both were below normal with a record low April groundwater level in Carroll County, Maryland
Precipitation | Groundwater | Streamflow | Chesapeake Bay | Reservoirs | Archive of WC Reports
Why is it important for the USGS to collect and analyze water resources data?
USGS water data are valuable to the public, researchers, water managers, planners, and agricultural users, especially during floods and droughts. These data can be used to assess how water resources respond to changes in climate. Scientists at the USGS have measured streamflow and groundwater levels in wells to assess water resources for over 125 years.
In addition to providing the most extensive set of historical streamflow and groundwater data available to the public, the USGS collects water data and quality-assures the data by employing standardized techniques across the country. The uniformity of the dataset allows for multi-state comparisons and other comparative statistical analyses that better inform policy makers of the possible water resource conditions they might encounter in the future.
The sites used in this water summary were carefully selected to show the response of streamflow and groundwater levels to precipitation. Ideally, these sites will show minimal effects from human influences. The streamflow and groundwater data are ranked in comparison to the historical record and summarized. Precipitation and reservoir data are also presented to give a more complete picture of the region’s water resources.
USGS April 2013 Water Conditions Summary
In April, more than half of the monthly groundwater and streamflow gaging sites used to monitor the response of water resources to changes in climatic conditions in Maryland, Delaware, and the District of Columbia were in the normal range (between the 25th and 75th percentiles). Of the remaining sites, 38 percent of the groundwater levels and 27 percent of the streamflow gaging sites were below normal.
One of the USGS monitoring wells in Carroll County, Maryland set a monthly record low groundwater level for April. There were another nine sites with groundwater levels below normal in Maryland and Delaware. Two sites had above normal groundwater levels in April. Monthly mean streamflow at Sallie Harris Creek on the Delmarva Peninsula was above normal in April.


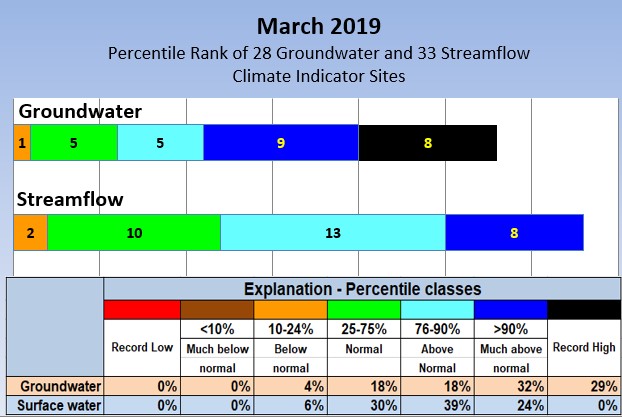
A percentile is a value on a scale from 0 to 100 that
indicates the percent of a distribution that is equal to or below it. For
example, a groundwater level in the 90th percentile is equal to or greater
than 90 percent of the values recorded for that month.
April 2013 Precipitation and Weather
April precipitation was below the long-term average at four of the five National Weather Service (NWS) stations in Maryland, Delaware, and the District of Columbia in April. Rainfall at the weather station in Georgetown, Delaware was 0.46 inches above normal. According to the National Weather Service Middle Atlantic River Forecast web site, since January 1 all counties in Maryland and Delaware have been within the long-term average except for Garrett County, Maryland, which is over 4 inches below average.
April temperatures were 0.7 – 2.1 degrees Fahrenheit above the long-term average at all five weather stations, according to the NWS. The NWS normal (long-term average) period used for determining records is from 1981-2010.

*Note from the National Weather Service: September 2011 was the first month to incorporate the new 1981--2010 climate normals that were calculated by the National Climatic Data Center. The new normals replaced the 1971--2000 normals.
Sources: |
National Weather Service |
Groundwater
The USGS monitors groundwater levels in unconfined aquifers, providing observations that can be compared to both short-term and long-term changes in climatic conditions. Twenty-six groundwater wells were selected based on the following criteria:
- Located in an unconfined (water-table) aquifer;
- Open to a single, known hydrogeologic unit/aquifer;
- Groundwater hydrograph reflects changes in climatic conditions;
- No indicated nearby pumpage and likely to remain uninfluenced by pumpage, regulated streamflow, or changes related to human activities;
- Minimum period of record is 10 years of continuous/monthly records;
- Minimally affected by irrigation, canals, drains, pipelines, and other potential sources of artificial recharge;
- Well has casing – dug wells are not used;
- Water levels show no apparent hydrologic connection to nearby streams;
- Well has never gone dry; and
- Long-term accessibility likely.
- Minimum period of record is 10 years of continuous data;
- Watershed areas greater than 5 square miles;
- Streamflow is not regulated, or has relatively natural flow;
- Streamflow data reflect climatic conditions; and
- The surrounding area and watershed are not urban.
April 2013 Groundwater
![]() |
More than 50 percent of the groundwater levels used to monitor climatic conditions in Maryland and Delaware were in the normal range in April 2013. Normal is considered to be between the 25th and 75th percentiles. The groundwater level in monitoring well CL Ad 47 in Union Mills in Carroll County has been below normal all year and in April it was at a record monthly low. The monitoring wells in Montgomery and Prince George’s Counties were also low, in the (lowest) 10th percentile (shown in brown circles on the map). Monitoring wells in Charles and Frederick Counties had groundwater levels above normal (shown in light blue circles on the map).
To access the clickable groundwater map, go to: http://md.water.usgs.gov/groundwater/web_wells/current/water_table/counties/index.html
|
These 5-year hydrographs show groundwater levels as a dark blue line, the minimum and maximum monthly values, and the normal range (between the 25th and 75th percentiles) as a white band based on the period of record. The maximum water level is at the top of the blue section and the minimum water level is at the bottom of the blue section in the graph. Record monthly lows are shown in red and record monthly highs are shown in light blue.

These 5-year hydrographs show groundwater levels as a dark blue line, the minimum and maximum monthly values, and the normal range (between the 25th and 75th percentiles) as a white band based on the period of record. The maximum water level is at the top of the blue section and the minimum water level is at the bottom of the blue section in the graph.

The USGS real-time 120-day hydrograph also shows the low April 2013 groundwater level at monitoring well CL Ad 47.
Streamflow
Streamflow data are used for many purposes. A few of the most obvious uses are to assess water supply and the risk of droughts and floods. Streamflow data are also used to calculate loads of chemical constituents and assess how biological communities are affected by hydrologic conditions. The USGS operates the most extensive network of streamflow gages in the region.
The streamflow locations chosen for the monthly water summary were selected based on the following criteria:
April 2013 Streamflow
Twenty-three of the 33 USGS streamgages used to monitor climatic response in Maryland, Delaware, and the District of Columbia had normal streamflow levels in April; this is five fewer streamgaging stations with normal streamflow levels than in March. Monthly mean streamflow at nine streamgages was below normal and clustered in two groups--one in Cecil County, Maryland and northern Delaware, and the other in Frederick and Washington Counties in Maryland. Monthly mean streamflow was above normal at one streamgage (Sallie Harris Creek) on the Delmarva Peninsula. Normal is considered to be between the 25th and 75th percentiles.
To access the clickable streamflow map, go to: http://md.water.usgs.gov/surfacewater/streamflow/
Monthly mean streamflow at Brandywine Creek in New Castle County, Delaware is following a seasonal trend with the water level declining at this time of year, but it appears to be doing so a month or two earlier than the long-term trend. Based on the historical pattern, streamflow is expected to begin dropping in May.

Five-year hydrographs can be viewed at:
http://md.water.usgs.gov/surfacewater/streamflow/
The dark line in the 5-year hydrograph represents the monthly mean streamflow for this period and the white band shows the normal range (25th to 75th percentile) based on the period of record. The maximum monthly mean streamflow is at the top of the blue shaded section, and the lowest monthly mean streamflow is at the top of the dark orange area.
Estimated Streamflow to the Chesapeake Bay
The estimated monthly mean freshwater streamflow to Chesapeake Bay was b normal in April 2013, at 105,000 cubic feet per second (ft3/s; provisional and subject to revision). The normal range for average (mean) monthly streamflow for April is between 95,700 ft3/s and 179,000 ft3/s, the 25th and 75th percentiles of all April values. These provisional statistics are based on a 76-year period of record.

Data and more information on the freshwater flow to the Chesapeake Bay can be found here: Chesapeake Bay Inflow. http://md.water.usgs.gov/waterdata/chesinflow/
Graphs and data are available on the “Estimated Streamflow Entering Chesapeake Bay” website.
Reservoir Levels
Reservoir storage at the end of April in the Baltimore reservoirs (Loch Raven, Liberty, and Prettyboy) remained at 100 percent of available storage capacity, with a total of 75.85 billion gallons of water.
Total storage in the Triadelphia and Duckett Reservoirs, which serve parts of Howard, Montgomery, and Prince George’s Counties in suburban areas around the District of Columbia, was over 101 percent of normal storage capacity with 10.71 billion gallons in April.
All reservoirs except Duckett Reservoir, whose levels were dropped for maintenance in February have been at or above 100% since November 2012.
|
April |
Percent available/ normal storage |
Volume (billion gallons) | Source |
|---|---|---|---|
| Baltimore Reservoirs | Baltimore City - Environmental Services Division | ||
| Liberty | 100% |
36.80 |
|
| Loch Raven | 100% |
21.20 |
|
| Prettyboy | 100% |
17.85 |
|
| Total | 100% |
75.85 |
|
| Patuxent Reservoirs | Washington Suburban Sanitary Commission (WSSC) | ||
| Triadelphia | 101% |
5.67 |
|
| Duckett | 101% |
5.04 |
|
| Total | 101% |
10.71 |
|
More Information
- Additional Archives
- Water Conditions Reports: 2000-present
- Maryland-Delaware-District of Columbia
- USGS Drought Watch
- USGS Water Summary
- Streamflow
- Groundwater
- Chesapeake Bay National
- USGS Streamflow and Groundwater levels
- U.S. Drought Monitor from the National Drought Mitigation Center
Compiled by: Wendy S. McPherson, USGS Hydrologist
Contact
U.S. Department of the Interior
U.S. Geological Survey
Wendy S. McPherson (wsmcpher@usgs.gov)
* If you want to receive notification of updates to the water conditions or receive the file, send and email to Wendy S. McPherson at wsmcpher@usgs with a message "Send monthly water conditions report".
Maryland-Delaware-D.C. Water Science Center
5522 Research Park Drive
Baltimore MD, 21228
Phone:443-498-5548


